What Is Distributed Tracing?
Distributed tracing is vital to manage the performance of applications that use microservices and containerization
What Is Distributed Tracing?
What Is Distributed Tracing?
Organizations are increasingly developing and deploying their applications using service-oriented architecture (SOA) and are leveraging microservices, containerization, and distributed deployments for increased agility and flexibility in development, testing, and production phases. However, this leads to an increased number of components in an application, and it becomes chaotic to pinpoint performance issues and troubleshoot incidents.
Distributed tracing is a method to helps engineering teams with application monitoring, especially applications architected using microservices. It helps pinpoint issues and identify root causes to address failures and suboptimal performance.
In an application consisting of several microservices, a request may require invoking several services. Accordingly, a failure in one service may trigger failures in other services. To understand clearly how each service is performing with respect to servicing a request, distributed tracing tracks each request end to end and assigns a unique trace ID to identify each request and associated trace data. In general, this is achieved by adding instrumentation to the application code or by deploying auto-instrumentation in the application environment.
What Is a Trace?
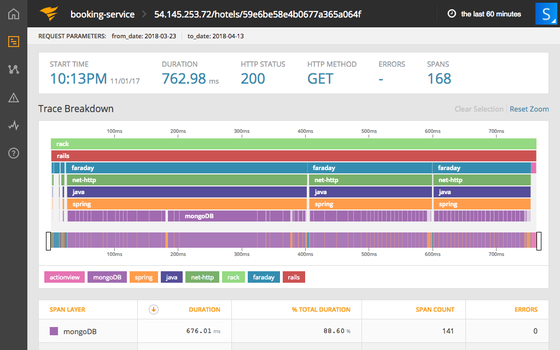
A trace represents how a request spans across various services of an application. A request can result from an end user’s action or due to an internal trigger such as a scheduled job.
A trace is a collection of one or more spans. A span represents a unit of work done between two services and includes request and response data, timespan, and metadata such as logs and tags. Spans within a trace also have parent-child relationships representing how various services contributed to serving a request.
Distributed tracing also helps identify common paths in serving a request and services most critical to the business. Using this information, an organization can deploy more resources to encapsulate essential services from scenarios that can result in disruption.
Distributed Tracing vs. Logging
Distributed Tracing Benefits
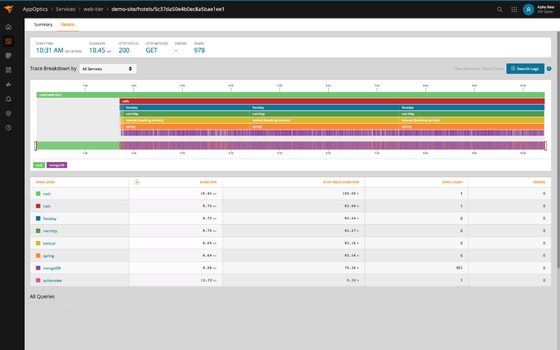
Distributed tracing is a common feature among some of the best application performance monitoring (APM) tools. APM tools drive the following benefits using distributed tracing:
Visibility: Distributed tracing provides end-to-end visibility into the application environment. Some APM tools leverage distributed tracing to represent service dependencies and the overall application environment visually. This is especially beneficial if an application comprises hundreds of microservices running across multiple data centers and availability regions. As the number of services and the infrastructure components increases, it becomes chaotic to manage, maintain, and track their contribution to the application environment. Visualizing application environments brings clarity to this chaos and aids in quickly pointing out services responsible for problems.
Performance: As each service’s request and response times are tracked, it becomes easier to understand performance and then scale or troubleshoot only the individual services required to improve overall performance and system health. APM tools also provide in-depth visualization of performance metrics to help identify performance variance and response times in different circumstances and determine a baseline performance. For example, when a change is applied to the application environment, the performance impact of the change can be benchmarked to analyze the systemic effects of changes on the overall performance in the future.
Root Cause Analysis: A distributed application could be serving hundreds of thousands of requests per day; for example, consider a distributed e-commerce application serving hundreds of thousands of customers a day. Similarly, this produces vast amounts of trace data, and unless the traces are correlated, distributed tracing can provide little value. Because an error or issue in one service or component may trigger subsequent failures in other services, analyzing and correlating traces is critical to identify root causes and fix problems early on. Some APM tools continuously correlate traces and related events to report performance issues and bottlenecks proactively.
What Is Distributed Tracing?
What Is Distributed Tracing?
Organizations are increasingly developing and deploying their applications using service-oriented architecture (SOA) and are leveraging microservices, containerization, and distributed deployments for increased agility and flexibility in development, testing, and production phases. However, this leads to an increased number of components in an application, and it becomes chaotic to pinpoint performance issues and troubleshoot incidents.
Distributed tracing is a method to helps engineering teams with application monitoring, especially applications architected using microservices. It helps pinpoint issues and identify root causes to address failures and suboptimal performance.
In an application consisting of several microservices, a request may require invoking several services. Accordingly, a failure in one service may trigger failures in other services. To understand clearly how each service is performing with respect to servicing a request, distributed tracing tracks each request end to end and assigns a unique trace ID to identify each request and associated trace data. In general, this is achieved by adding instrumentation to the application code or by deploying auto-instrumentation in the application environment.
What Is a Trace?

A trace represents how a request spans across various services of an application. A request can result from an end user’s action or due to an internal trigger such as a scheduled job.
A trace is a collection of one or more spans. A span represents a unit of work done between two services and includes request and response data, timespan, and metadata such as logs and tags. Spans within a trace also have parent-child relationships representing how various services contributed to serving a request.
Distributed tracing also helps identify common paths in serving a request and services most critical to the business. Using this information, an organization can deploy more resources to encapsulate essential services from scenarios that can result in disruption.
Distributed Tracing vs. Logging
 While distributed tracing tracks each request and its interaction with services and components in the application environment, logging continually captures the state of a service, component, or host machine. However, logging is specific to each service or host machine and can generate substantial amounts of data. Generally, log management tools gather logs from various sources and use structured logging to make it easier to sift through the data. On the other hand, distributed tracing identifies where the issue is, but it might not necessarily provide enough insights to understand the problem deeply. In such cases, log data can help you dig deeper into the problem as it provides more granular data. This is also why some application performance monitoring (APM) tools attach relevant log data to traces.
Distributed Tracing Benefits

Distributed tracing is a common feature among some of the best application performance monitoring (APM) tools. APM tools drive the following benefits using distributed tracing:
Visibility: Distributed tracing provides end-to-end visibility into the application environment. Some APM tools leverage distributed tracing to represent service dependencies and the overall application environment visually. This is especially beneficial if an application comprises hundreds of microservices running across multiple data centers and availability regions. As the number of services and the infrastructure components increases, it becomes chaotic to manage, maintain, and track their contribution to the application environment. Visualizing application environments brings clarity to this chaos and aids in quickly pointing out services responsible for problems.
Performance: As each service’s request and response times are tracked, it becomes easier to understand performance and then scale or troubleshoot only the individual services required to improve overall performance and system health. APM tools also provide in-depth visualization of performance metrics to help identify performance variance and response times in different circumstances and determine a baseline performance. For example, when a change is applied to the application environment, the performance impact of the change can be benchmarked to analyze the systemic effects of changes on the overall performance in the future.
Root Cause Analysis: A distributed application could be serving hundreds of thousands of requests per day; for example, consider a distributed e-commerce application serving hundreds of thousands of customers a day. Similarly, this produces vast amounts of trace data, and unless the traces are correlated, distributed tracing can provide little value. Because an error or issue in one service or component may trigger subsequent failures in other services, analyzing and correlating traces is critical to identify root causes and fix problems early on. Some APM tools continuously correlate traces and related events to report performance issues and bottlenecks proactively.
Unify and extend visibility across the entire SaaS technology stack supporting your modern and custom web applications.